
Tensile Test
The tensile specimens are machined from sheets according to the dimensions as shown in the diagram below. In addition, specimens along the rolling, transverse and 45o direction are prepared and will be-compared in the flow stress measurement.
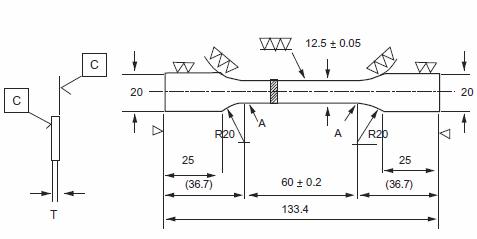
1. No machining of surface C
– Roughness of Surface C is same as raw material surface
– Thickness T is same as raw material thickness
2. Surface are connected smoothly at A. (Non step at A)
3. All dimensions are in mm
Uniaxial Tensile Test
Instron 4505 mechanical testing machine is used in this tensile testing to determine the flow stress data of the stainless steel materials. The extension speed was set at a constant speed of 5mm/min for all the material used. True strain () and true stress were calculated from the measured values of tensile load and stroke by the following equation:
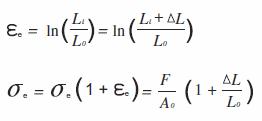
where,  is instantaneous length,
  is the initial strength,
  is change in length (or machine stroke),
  is the
engineering stress,  is the engineering strain,
  is the initial area of the test
Tensile Testing of 316L Stainless Steel
Flow Stress Plot
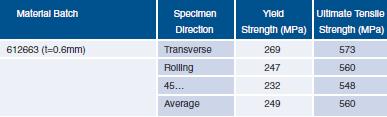
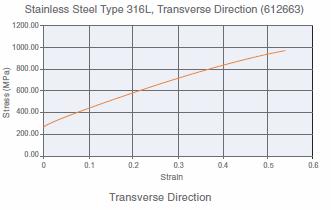
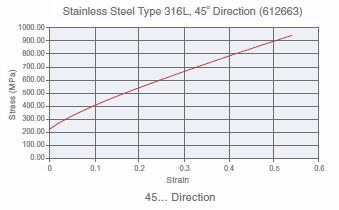
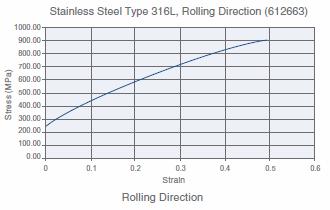
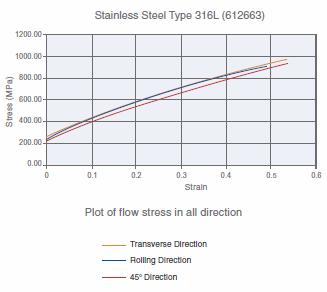
The table below shows the yield strength and ultimate tensile strength for Stainless Steel 316L. The figures on the next page shows the stress-strain curves of Stainless Steel Type 316L determined from the tensile test for specimen thickness 0.6 mm in transverse, rolling and 45… direction. From the combined plots of the stress-strain curves in the 3 direction, the maximum differences in stress are approximately 4%. The highest differences will be on the flow stress along the 45… of the rolling directions for the wall thickness of 0.6mm.
Yield strength and ultimate tensile strength for Stainless Steel Type 316L
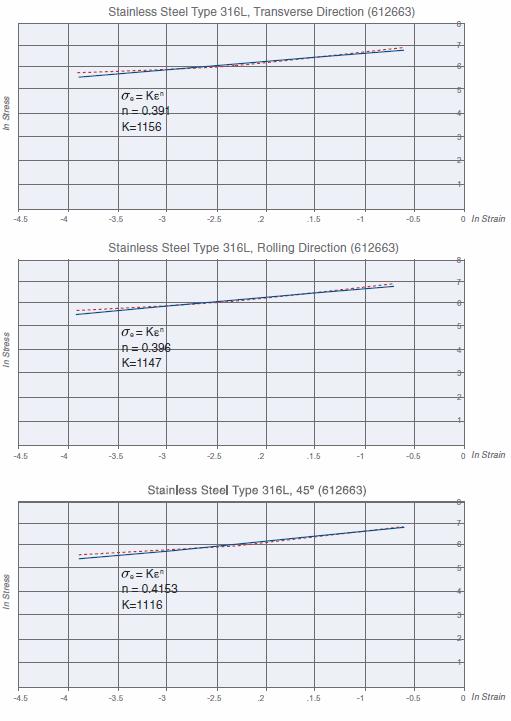
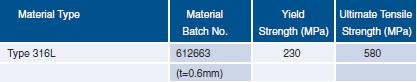
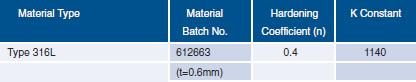
Logarithmic Plot of Stress-strain data
The figures below shows the logarithmic plot of stress-strain data. The values of work hardening exponent (n) and K in the expression of were determined from the equation of straight line obtained by least square fitting.
Yield strength and ultimate tensile strength for Stainless Steel Type 316L
Summary and Conclusion
From the tensile tests, important material properties such as Yield Strength and Ultimate Tensile Strength are determined from the stress-strain curves and are summarized in the table below.
Summary of the average yield strength (0.2% strain) and ultimate tensile strength
From the logarithmic plot of stress-strain data, the average values of work hardening exponent (n) and K in the expression of material flow stress equation are determined and summarized at the table below.
Summary of the average work hardening coefficient (n) and K constant values
It is also concluded that the influence of material direction on flow stress is somewhat significant since the differences in stress are approximately 8% in all the materials tested. The difference in stress along different directions will determine the resistance of sheet along the thickness direction. In other words, the material tends to form without significantly changing in the wall thickness.